
TL;DR — In this analysis, we estimated the impact of listing a token on three exchanges: Bybit, Binance, and MEXC. Price and listing data were used for the analysis. Data was extracted by using methods specific to these exchanges. The study indicated that 7 days post-listing, Bybit and Binance listings were bullish. Over the 30-day and 60-day period, listings on all exchanges showed no clear statistical significance from regression estimates, although directionally, the regression estimates were bullish. In contrast to this, over the 30-day and 60-day period, the price action was bearish from the pre-post analysis. For traders, our research provides a primer of strategy: buy before listing if possible, or on the day of listing and sell before the 7th day. Smaller tokens on Binance may be more bullish than other token listings.
Contents
- Introduction
- Summary table
- Methodology
- Analysis
- Limitations and next steps
We’ve all seen the passionate bull posts that flood Crypto Twitter leading up to and upon a fan base’s coveted token getting listed on large centralized exchanges (CEXs), followed by unpredictable price action and oftentimes (especially in 2024) a market dump — at least, that’s the general consensus you’ll find online nowadays.
That’s just social media sentiment and noise.
What does the data say? What actually happens when tokens get listed on CEXs, and how can you use that knowledge to your advantage?
Previous literature (Ante, 2019) suggests a significantly abnormal return of 7.4% on listing day and 9.2% three days after listing. This bullish view is supported by a CoinDesk article (Yang, 2023), which suggested that listings on Binance jump up 41% after listing. On the other hand, a study by Animoca Research (Ouyang, 2024) suggests a 49% drop after CEX listings on average but a large amount of variation depending on the exchange. Another analysis by Blockworks (Canellis, 2024) suggests that tokens could be bullish in the short term but this is short-lived.
In this research, we further this analysis by conducting it across multiple exchanges and various durations; we will also distinguish between pre-post analysis and a causal estimation to get a better estimate of the true effect of listing. The objective here is to have the primitives of an investment or trading strategy for backtesting.

Insights
Three periods were analyzed: 7 days, 30 days, and 60 days. Pre-post descriptive analysis was conducted as a first step. Note that there are many limitations to using pre-post analysis, such as exogenous factors affecting a pre-existing trend.
The main limitation of the pre-post analysis is that many external variables make the pre-period a poor counterfactual to compare the post-period to. One such variable is market conditions; these may affect any comparisons made more than the listing effect. Another variable is whether the token is already listed on any other CEX, requiring a more comprehensive analysis of all exchange listings.
We might expect bullish market conditions to correlate with more token listings as more tokens are created. However, when we plot token listings over time, we see no sudden jump in listings; it is a reasonably consistent, steady listing pace for both exchanges. Normalizing our listing date to 0 helps our comparisons slightly; it represents many dates throughout 2024 across more bullish and bearish market conditions.
Listings over time
The below figures show consistent listings across 2024 for all exchanges. Bybit listed almost three times as many tokens as Binance did over a similar period in 2024, and MEXC was around three times more than Bybit.
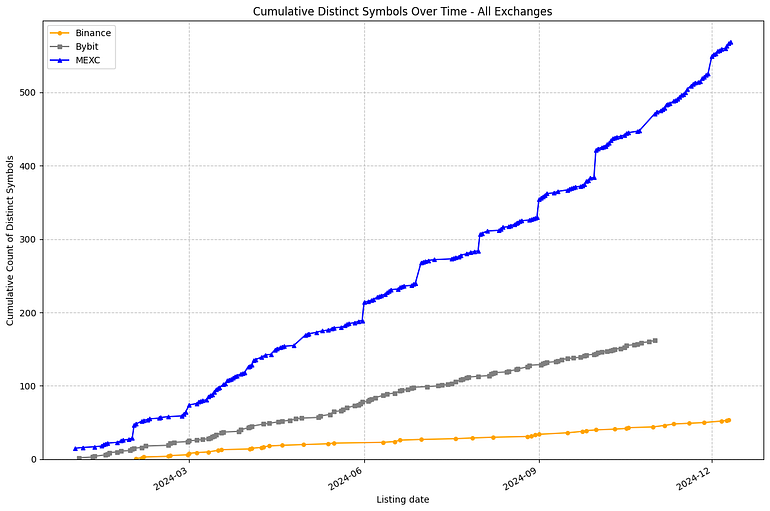
When analyzing the size of the listings, we can see that a larger proportion of listings on Binance were $500M capitalization, ~26% of tokens, compared to the other exchanges. In contrast to this, MEXC had mostly smaller listings, with only ~3.6% of token listings above $500M.

Pre-post analysis comparison over time
This relatively similar distribution and pacing of exchange listings enables some pre-post comparison across the exchanges when normalizing the listing date to day 0.
To allow easy comparison across hundreds of tokens, the listing date is indexed to 0, and the days around this are shown. The price is also indexed to the day before the listing, since the day of the listing may already be impacted by the listing. This enables easier visualization of any clear discontinuity occurring on or around the listing date.
Importantly, note that the pool of tokens is different between the time periods and can be different for the same exchange because the longer time periods are filtered to tokens that have more days since listing; the short period comparison, therefore, has more tokens included. This can affect median ROI calculations.
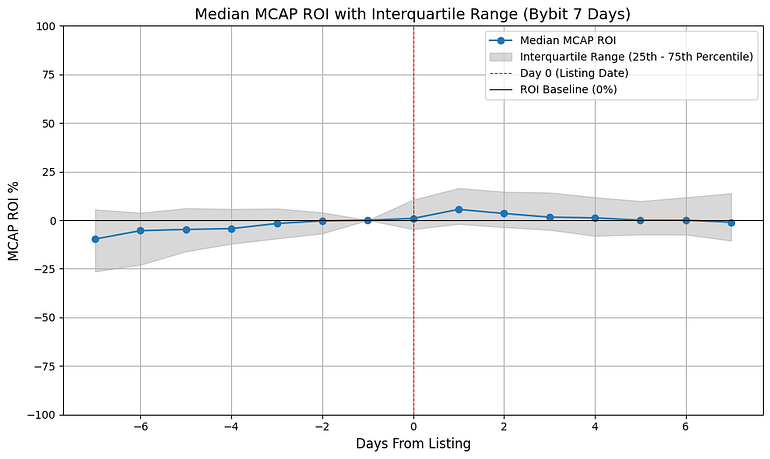
7-day pre-post comparison
The data suggests that listings on Bybit have no median ROI increase in market capitalization over 7 days post-listing and perhaps a small increase 1–2 days post-listing. There is also an increase before the listing, which may be around the time of the listing announcement on social media or insiders trading the token.
Listings on Binance suggest a bullish effect within 1–2 days of listing which gradually decreases within 7 days of listing; unlike Bybit, it does not have a slight pre-existing upward trend which suggests little announcement or insider pump.
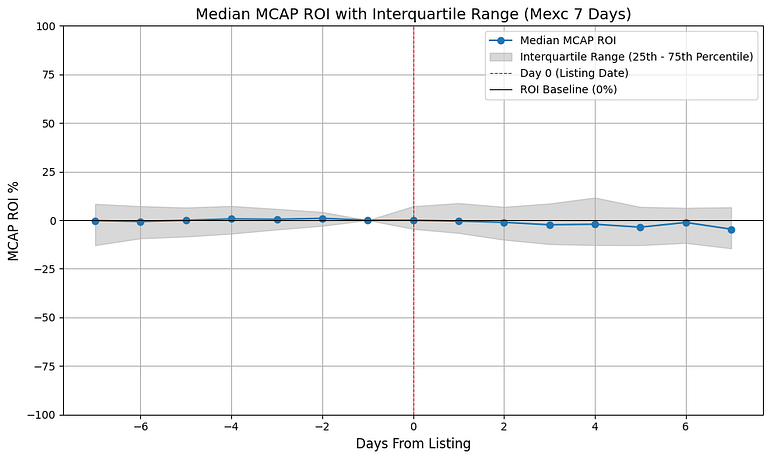
Listings on MEXC suggest a slight bearish effect within 7 days of listing with no pre-existing effect of listing.
Below we see the median effect of listing for each exchange on tokens.

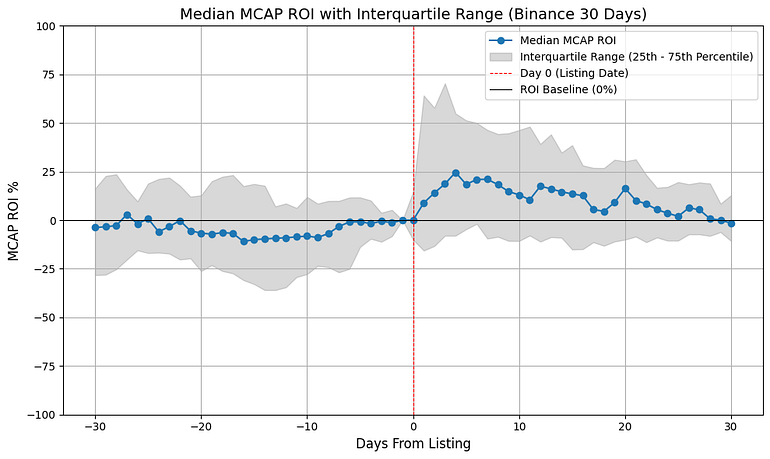
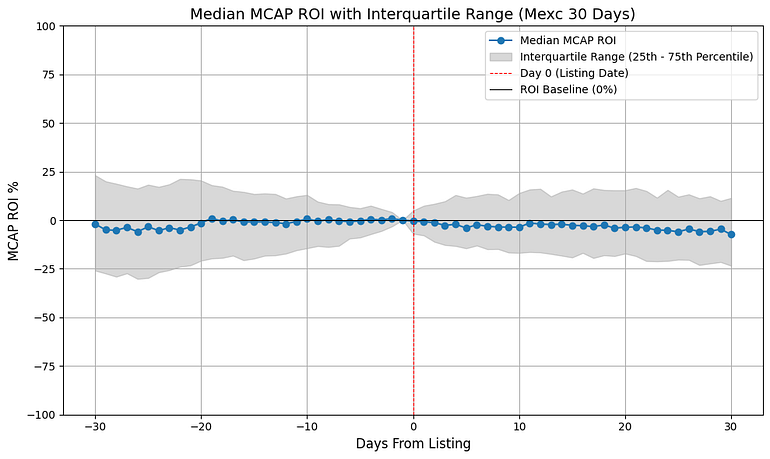
30-day pre-post comparison
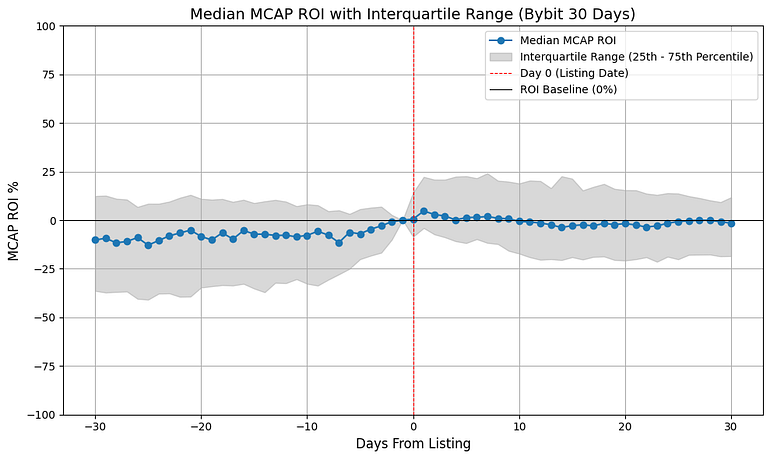
With tokens that list on Bybit, we observe a neutral ROI over 30 days; we only observe a slight increase around the listing. There seems to be an increase in token price the week before listing and then a gradual sell-off. This confirms the old adage; “buy the rumor, sell the news/event”.
Tokens listing on Binance, on the other hand, see a small increase before listing, a pump up to several days post listing, and then this gradually sells off back down to no ROI over 30 days.
On MEXC, we observe a slight gradual but noticeable drop in ROI 30 days post-launch.
Note that due to the need for 30 and 60 days of data post-listing for these analyses, the tokens that are in-scope can differ within the same exchange listings between time periods. This is why median returns will not align between 7, 30, and 60 days at the same time intervals on each chart.
60-day pre-post comparison
Over 60 days, for tokens that list on Bybit, we observe an initial increase and then some drop in the median market capitalization ROI over a longer period. There seems to be quite a substantial run-up in price in the 7 days prior to listing which could create a trading strategy if the listing announcement is public.
Binance again indicates an initial pump over the first few days, and this eventually sells off over time. Note that the number of tokens in scope for Binance over this time period is much fewer than the other exchanges and also when compared to tokens over 7 days. MEXC indicates a gradual and consistent sell-off post-listing.

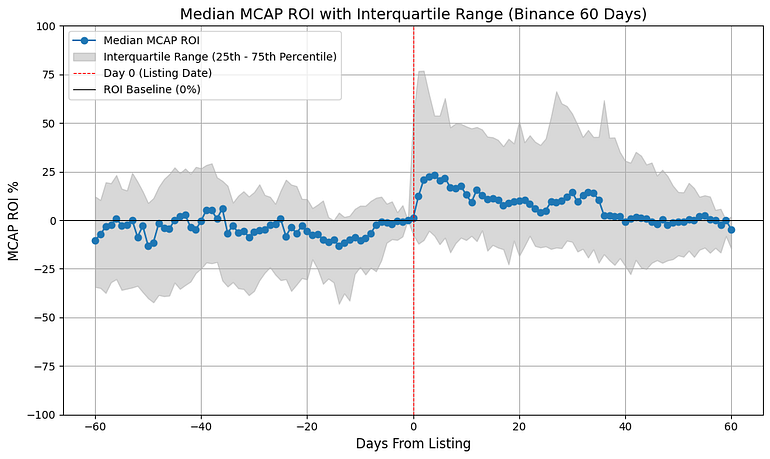

Over 60 days after the token listing, market conditions are more likely to come into effect than the token listing, which may explain the drop across all exchanges. What is noteworthy, though, is that Bybit and MEXC show a greater relative drop than Binance, suggesting that they are correlated with more bearish outcomes in the longer term post-listing.
Another method of analysis we can do is analyzing the effect by listing size. As we segment the data further, it should be noted that per exchange and market capitalization bucket, we have fewer tokens per group, sometimes these will be too small for robust analysis and inference.
Most of the segmentation does not show any clear trend, except <$100M capitalization listings on Binance, this visualization is shown below. Other exchanges don’t show a clear trend when segmented by listing size and are not included in the report.

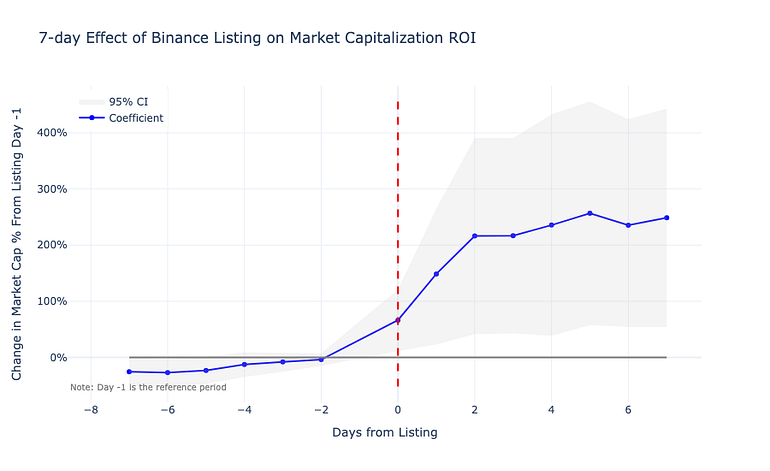
Staggered difference-in-difference analysis (a causal estimation)
As per Goodman-Bacon (2021), staggered difference-in-difference is a more robust estimation method when treatment timing varies. In this analysis, we can compare tokens that list on each exchange against tokens that are yet to be listed on each exchange, adjusted for the days before listing. Using this method, we control for pre-existing temporal trends that may lead to inaccurate causal assumptions. Additionally, comparing tokens within each exchange controls for biases that might arise that are exchange-specific, such as if certain types of tokens list more frequently on each exchange compared to others.
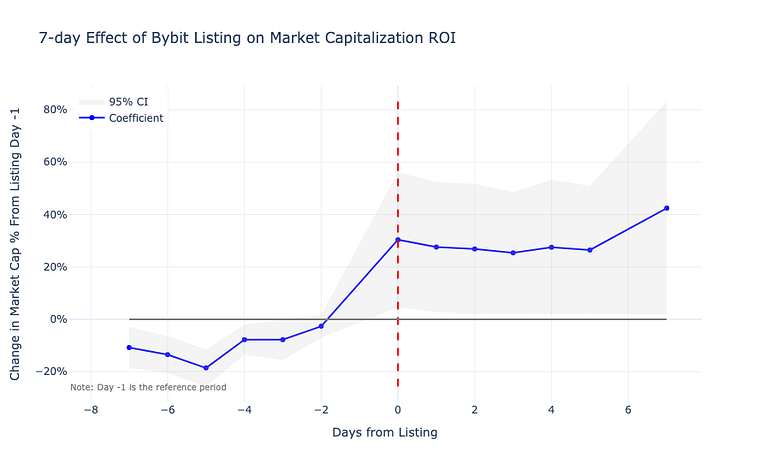
Below are graphs that show the causal impact estimate of listing on each exchange. Only the analysis for 7 days is included, 30 and 60 days post-listing analysis was excluded due to very large confidence intervals that occur which makes all results statistically insignificant.
Indexing is done the day before intervention to adjust for the day of intervention having an effect itself. All returns are therefore indexed to days from listing -1, which is removed from the visualization.
Interestingly, both Bybit and Binance show bullish price action over 7 days using this estimation method with statistical significance but have very wide confidence intervals.
7-day staggered difference-in-difference comparison

Methodology
Data on listings was pulled via Binance’s publicly available API. However, tokens defaulted to the start of the month, and therefore, each one had to be manually updated by checking timelines per token on TradingView. For Bybit, data was pulled by scraping their website archives by looking at file names. For MEXC, data was pulled from their SDK and trading pairs history API; a live account is required.
These were filtered to 2024 data, filtered to USDT pairs only, cleaned to symbols, and joined with CoinGecko price data. In some cases, manual adjustments were made to ensure a join was possible. However, not all of the listed tokens were joined to CoinGecko correctly.
Binance, Bybit and MEXC data were retrieved due to challenges with making many API calls. Many of these required manual date assignment and joining to CoinGecko data. For this reason, only 2024 data has been used for these three exchanges.
The resulting dataset used in the analysis is one row per day per token with the token’s market capitalization on that day and the days until it lists. Each exchange had its own dataset so that comparisons could be made between tokens within each exchange.
Two types of analysis are included below: pre-post analysis, which looks at prices for the same token over time before and after listing, and difference-in-difference, an econometrics technique that compares token listings to other tokens that have not yet been listed within each exchange. The latter method, although harder to understand, has its own merits, which are discussed below.
Note that ROI is indexed to the day before listing, -1, because this is before any listing effect actually shows up in the data.
Analysis limitations and next steps
Limitations with Pre-post analysis
Any analysis of in-unit variation pre and post-listing is subject to many exogenous variables, which means any causal impact relation is not possible. One major bias is market conditions, i.e., how do we know that the change in market capitalization of that token is due to listing if other tokens are also trending the same way? In bullish market conditions most market capitalizations are increasing with time regardless of day 0 indexing. Another bias is that tokens that list on Binance may fundamentally differ from those of MEXC, or an exchange may offer Perpetual Futures alongside spot listings, which could enable short-selling pressure.
To make any robust correlational or causal claim of impact, a counterfactual must be estimated from a control group of tokens that were not listed over the same period. This is why the difference-in-difference provides a better estimated causal impact of listing.
Another important note is that the effect of listing may precede the actual listing due to the announcement made. There may actually be two effects that are playing out: one of the token listing announcements and one when the actual token is listed.
Token Bias Between Bybit, Binance, and MEXC
Descriptive comparison between exchanges also is not completely valid due to bias in the type of tokens that are listed. It is possible that Binance had tokens that were intrinsically different to Bybit and MEXC, which makes a relative comparison between these groups invalid. This is why using difference-in-difference for the causal estimate of listing within the exchange’s own token listing data, so Binance tokens compared to tokens within Binance data would provide a more accurate picture of the causal impact of listing.
The analysis also currently does not look at volume; with more time, this would be analyzed as well and may be a good feature to estimate market capitalization ROI.
Other exchange data
Data from other exchanges would be needed for a comprehensive view. However, there were many challenges with extracting this data. Each needed an account to query its API; none of the remaining exchanges had listing APIs, only trading history. This made too many API calls (even for 2024 data only) to be able to extract over a reasonable time.
Market Conditions
The analysis was done on listings over 2024, which was a bullish environment for crypto. More bearish market conditions may result in different effects of listing on price action.
Next Steps
Token listings on Binance look most promising to long leading up to and during the token listing in the short term. Smaller capitalization tokens (under $100M on Binance), although riskier may offer the best returns post-listing; however, the sample size of the analysis is small.
Listings on Bybit may also offer traders an opportunity to long, but with a much larger pre-listing pump, gains are harder to capitalize on once the token lists. All listing effects are short term and all gains tend to sell off after several days. Backtesting a < 7-day strategy upon listing may be an appropriate next step for traders.
References
Ante, L. (2019, September 8). Market Reaction to Exchange Listings of Cryptocurrencies.
Yang, J. (2023, January 6). Binance effect means 41% price spike for newly listed tokens. CoinDesk. [https://www.coindesk.com/markets/2023/01/06/binance-effect-means-41-price-spike-for-newly-listed-tokens]
Ouyang et al. (2024). 2024 Listing Performance Overview Jan-Sep.
[https://docsend.com/view/gze65pfvim3phadr]
Canellis, D. (2024, September 16). Major exchange listings: Coinbase, Binance. Blockworks. [https://blockworks.co/news/major-exchange-listings-coinbase-binance]
Goodman-Bacon, A. (2021). Difference-in-differences with variation in treatment timing. Journal of Econometrics, 225(2), 254–277. https://doi.org/10.1016/j.jeconom.2021.03.014

The value of digital asset investments may fall as well as rise, and you may get back less than you originally invested. It is therefore important that you understand the risks involved before investing. This report represents RockawayX’s view at a point in time, and information included has been sourced from third parties, such as companies in RockawayX-managed portfolios. While these sources are considered reliable, RockawayX has not independently verified this information and makes no warranties regarding its current accuracy or suitability for specific situations. We may also take the opposite view/position from that stated in this report. This is because our view may change as facts or circumstances change.
This material constitutes general advice only and not personal financial product, tax, legal, or investment advice, and does not take into account the specific investment objectives, financial situation or individual needs of any particular person. We recommend consulting with your own professional advisers on these topics. Any mention of securities or digital assets is for illustration only and does not imply a recommendation or constitute an offer of investment advisory services. Furthermore, this material is not intended for use by current or prospective investors and should not be used as the basis for any investment decisions regarding funds managed by RockawayX. Any potential investment in RockawayX funds would be subject to documentation such as a private placement memorandum, subscription agreement, and other relevant materials, which should be carefully reviewed in their entirety. The investments or portfolio companies mentioned may not represent all investments made by RockawayX, and past results do not assure similar outcomes in future investments.
